Q1FY2020 Result Update | Banking
July 22, 2019
RBL Bank
BUY
CMP
`500
Profitability improves; weak asset quality guidance
Target Price
`650
Particulars (` cr)
Q1FY20
Q4FY19
% chg (qoq)
Q1FY19
% chg (yoy)
Investment Period
12 Months
NII
817
739
11
553
48
Pre-prov. profit
619
560
11
432
43
PAT
267
247
8
190
41
Stock Info
RBL Bank (RBL) has reported a very strong set of numbers for Q1FY2020 on
Sector
Banking
profitability and growth fronts, however, on the asset quality front; the
Market Cap (` cr)
21,401
management has provided weak guidance. Key surprise was management’s
guidance on rise in GNPA and stressed pool (`1,000cr), which would push back
Beta
1.1
ROA target of 1.5% for Q2FY2021.
52 Week High / Low
716 / 439
Robust growth in advances; NIMs improve: During Q1FY2020, the bank’s
Avg. Daily Volume
1,98,787
advances grew by 35% yoy, out of which retail loan book increased 62% yoy to
Face Value (`)
10
constitute 32% of the total advances. The corporate loans inched up 23% yoy.
During the quarter, NIM increased by 19bps yoy to 4.23%, aided by higher yield
BSE Sensex
39,216
on advances (up 120bps yoy) as against cost of funds (up 40bps yoy). Rise in
Nifty
11,687
yield was on account of increasing MCLR rates as well as higher proportion of
Reuters Code
RATB BO
high-yielding non-wholesale book. NIMs have continued to expand since last 10
Bloomberg Code
RBK IN
quarters. However, going forward interest reversal on slippages would keep NIMs
under pressure.
Impressive deposit & fees income growth: When other banks are struggling to
garner deposits, RBL Bank has managed to report impressive growth of
Shareholding Pattern (%)
~35%/4% on yoy/qoq basis. CASA deposits also witnessed healthy growth of
Promoters
0.0
42%/7% on yoy/qoq basis. Increasing branch network and higher interest rates
have helped the bank. Total fee income grew ~41%/5% on yoy/qoq basis. Card
MF / Banks / Indian Fls
25.1
fees grew ~66%/21% on yoy/qoq basis, which now constitutes ~47% of fee
income and grew 600bps qoq. Increase in the number of cards and POS
FII / NRIs / OCBs
18.8
terminals have supported jump in card fee growth.
OPEX increased: Opex cost increased ~52%/16% on yoy/qoq basis, largely led
Indian Public / Others
56.1
by other Opex (69% yoy) led by (1) expenses owing to new branch additions, (2)
higher cost in cards business, and (3) processing fees for $150mn loan raised
from IFC expensed in this quarter. Management has guided for 60-80 branch
Abs. (%)
3m 1yr 3yr
additions in FY2020. Bank has planned to 2x the co-branded number of cards,
Sensex
0.6
5.0
34.7
which will likely keep C/I around 52% for FY2020E.
Fresh set of stressed pool: GNPA/NPA for the quarter remained stable at
RBL Bank
(25.8)
(13.3)
67.2
1.38%/0.65%. However, management’s guidance for next 2-3 quarters is (1)
GNPA could rise to the level of 2.25-2.5% (from C&IB segment), (2) additional
slippages of 30-40bps, (3) new stress pool is 1.75% of advance (`900-1,000cr).
Outlook & Valuation: RBL Bank’s fresh set of stressed pool would push back of
1.5% to Q2FY2021. We expect RBL Bank to grow its advances at CAGR of 33%
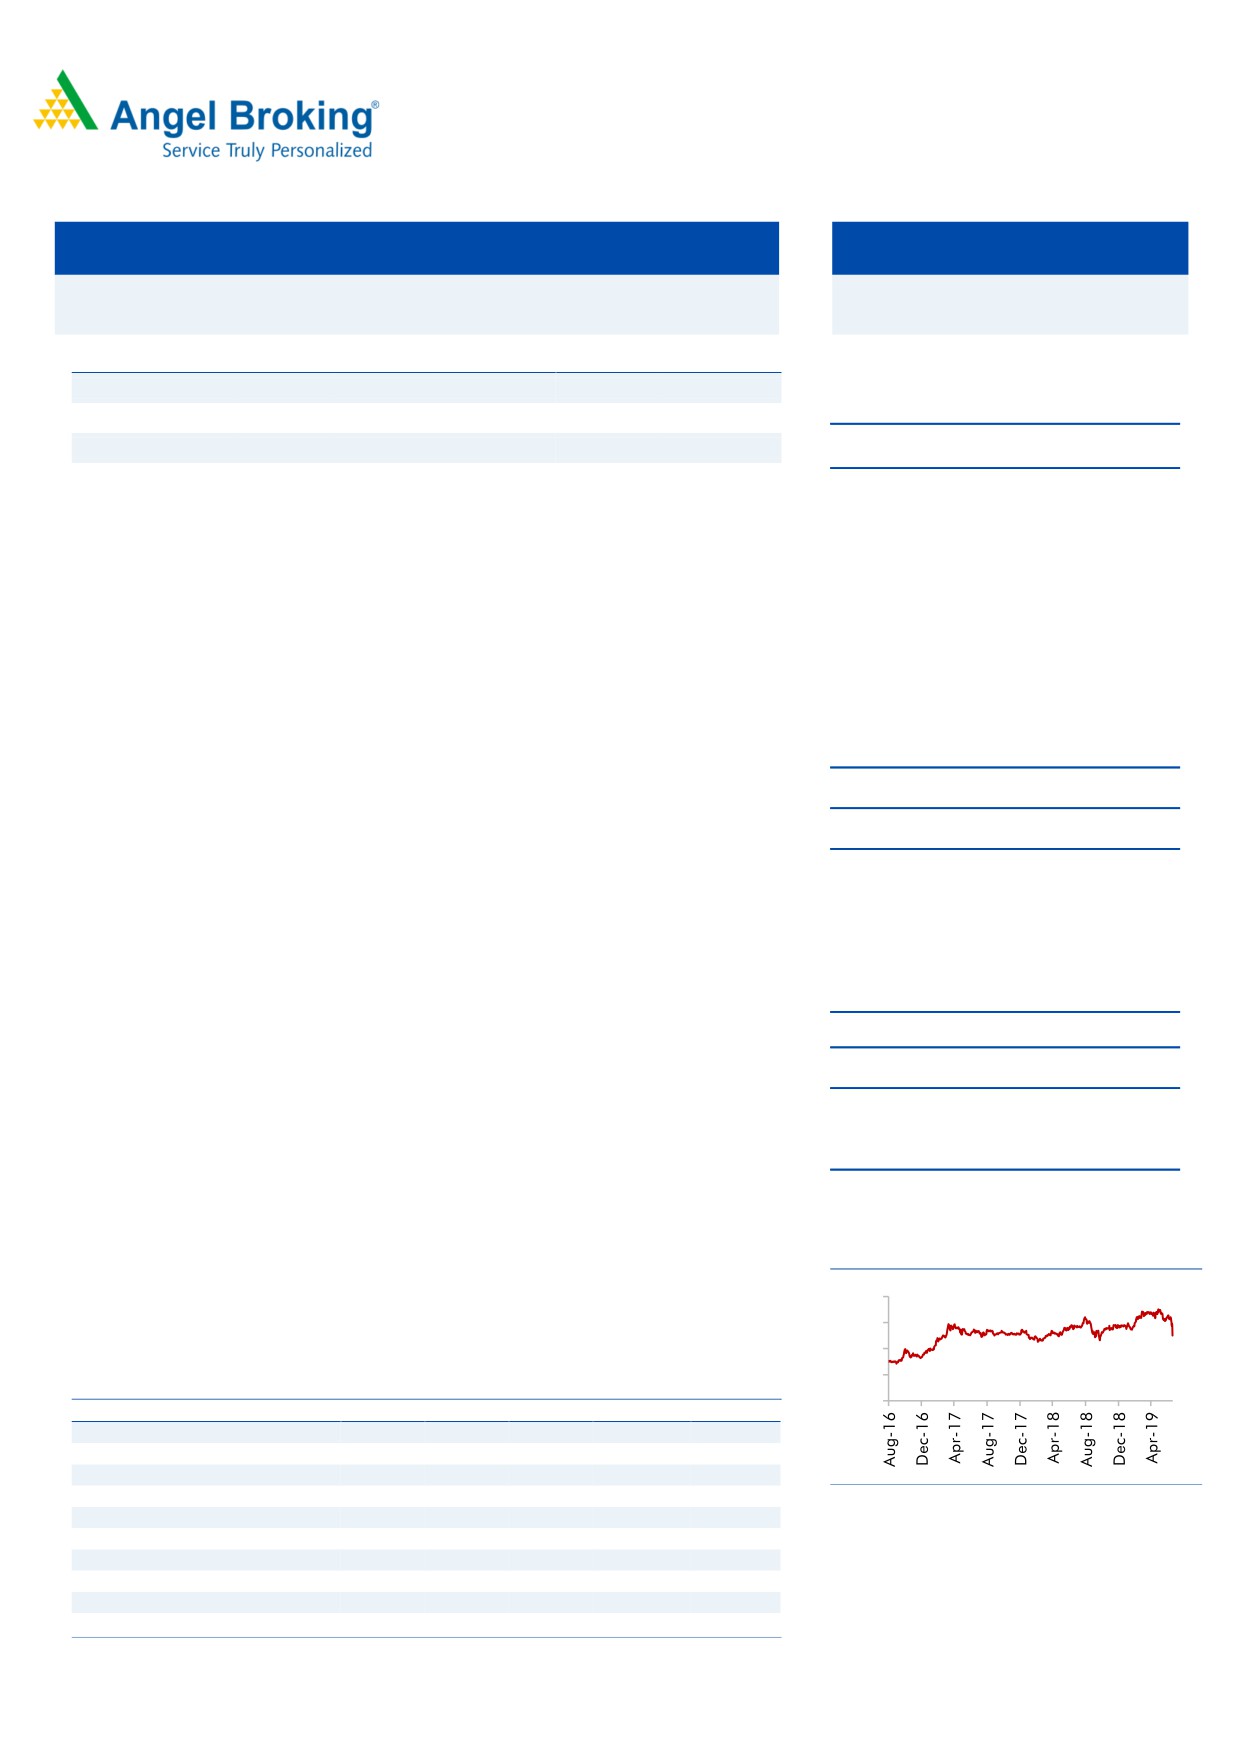
3-year price chart
over FY2019-21E. Improvement in CASA, higher share of retail book and in-
800
house priority sector lending will support NIM going forward. At CMP, RBL trades
600
at 2.3x FY21E P/ABV. We maintain our Buy rating with Target Price of `650 (3x
400
FY21EABV).
200
Key financials (Standalone)
0
Y/E March (` cr)
FY17
FY18
FY19
FY20E
FY21E
NII
1,221
1,766
2,539
3,434
4,635
% chg
42
27
33
34
34
Net profit
446
635
867
1,071
1,651
% chg
52.5
42.3
36.6
23.6
54.1
NIM (%)
2.9
3.4
3.7
3.8
3.9
EPS (`)
10.4
14.8
20.3
25.1
38.6
P/E (x)
46
32
24
19
12
Jaikishan Parmar
P/ABV (x)
4.8
3.1
2.8
2.5
2.2
Research Analyst
RoA (%)
1.0
1.1
1.2
1.1
1.33
RoE (%)
12.2
11.5
12.2
13.4
18.0
022 - 39357600 Ext: 6810
Source: Company, Angel Research, Valuation done on closing price of 19/07/19
Please refer to important disclosures at the end of this report
1
Q1FY2020 Result Update | India Research
Exhibit 1: Quarterly Performance
Particulars (` cr)
Q3FY18
Q4FY18
Q1FY19
Q2FY19
Q3FY19
Q4FY19
Q1FY20
% chg (yoy)
% chg (qoq)
Interest Earned
1,151
1,223
1,364
1,463
1,639
1,834
2,023
48
10
on Advances / Bills
888
953
1,077
1,173
1,330
1,469
1,619
50
10
on investments
245
250
261
261
274
297
340
30
14
on bal with RBI & others
16
17
19
23
24
45
42
124
(7)
on others
1
4
7
6
10
23
22
203
(5)
Interest Expended
684
722
812
870
984
1,095
1,205
49
10
Net Interest Income
467
500
553
593
655
739
817
48
11
Other Income
258
312
326
333
374
409
481
48
18
Trading
28
41
36
7
26
29
34
(6)
18
Core Fees
230
271
290
326
348
381
448
54
18
FX
34
38
35
39
38
46
54
54
18
Proc Fees
67
65
70
75
80
88
107
54
23
gen banking
28
38
35
46
49
42
54
54
28
Distribution
9
16
12
10
10
15
18
54
18
CC
71
90
116
131
143
156
179
54
15
Trades & other
21
27
23
29
28
34
36
54
5
Operating income
726
812
879
926
1,029
1,148
1,299
48
13
Operating Expenses
392
429
446
477
531
588
680
52
16
Employee expenses
144
131
153
151
164
168
185
21
10
Other Opex
248
299
293
326
367
420
495
69
18
Pre Provision Profit
333
383
432
449
498
560
619
43
11
Provisions & Contingencies
82
113
140
140
161
200
213
52
7
PBT
251
270
292
309
338
360
406
39
13
Provision for Taxes
86
92
102
105
113
113
139
36
23
Tax rate
34
34
35
34
33
31
34
PAT
165
178
190
205
225
247
267
41
8
Balance sheet
Q3FY18
Q4FY18
Q1FY19
Q2FY19
Q3FY19
Q4FY19
Q1FY20
% chg (yoy)
% chg (qoq)
Advance (` cr)
36,890
40,268
42,198
45,873
49,893
54,308
56,837
35
5
Deposit (` cr)
38,623
43,902
44,950
47,790
52,187
58,394
60,811
35
4
Credit-to-Deposit Ratio (%)
96
92
94
96
96
93
93
(41.3)bp
46.3bp
CA (` cr)
4,055
5,356
5,214
5,687
6,315
6,365
5,655
8
(11)
SA (` cr)
5,214
5,356
5,799
6,022
6,523
8,234
10,034
73
22
CASA deposits (` cr)
9,270
10,712
11,013
11,709
12,838
14,599
15,689
42
7
CASA %
24.00
24.40
24.50
24.50
24.60
25.00
25.80
5
3
CAR (%)
16
15
15
14
14
13
12
(220)bp
(106)bp
Tier 1 CAR (%)
14
14
13
13
13
12
11
(180)bp
(80)bp
Source: Company
July 22, 2019
2
Q1FY2020 Result Update | India Research
Exhibit 2: NIMs have continued to expand since last 10 quarters
Profitability Ratios (%)
Q3FY18
Q4FY18
Q1FY19
Q2FY19
Q3FY19
Q4FY19
Q1FY20
% chg (yoy)
% chg (qoq)
Yield on Adv Reported
10.4
10.5
10.8
10.9
11.2
11.8
12.0
120bp
20bp
Cost of funds Reported
6.2
6.2
6.4
6.4
6.6
6.8
6.8
40bp
0bp
NIM Reported
3.9
4.0
4.0
4.1
4.1
4.2
4.2
19bp
0bp
Cost-to-income ratio
0.54
0.53
0.51
0.52
0.52
0.51
0.52
1.5bp
1.1bp
Asset quality
Gross NPAs (` cr)
580
567
596
645
696
755
789
32
5
Gross NPAs (%)
1.60
1.40
1.40
1.42
1.38
1.38
1.38
(2)bp
0bp
Net NPAs (` cr)
358
313
316
339
358
373
372
18
(0)
Net NPAs (%)
1.0
0.8
0.7
0.7
0.7
0.7
0.7
(5)bp
(4)bp
PCR (%)
38
43
50
48
48
50
53
289.9bp
289.9bp
PCR Reported (%)
53
58
60
62
63
65
69
910bp
380bp
Slippage ratio (%)
0.6
0.3
0.4
0.3
0.4
0.4
0.4
4.5bp
1.7bp
Credit Cost on Adv (Annl)
0.9
1.1
1.3
1.2
1.3
1.5
1.5
17bp
2.7bp
Corporate Rating (%)
AAA
2.3
3.8
4.2
-
3.1
3.3
2.1
(210)bp
(120)bp
AA- & Above
13.2
11.4
10.4
-
10.3
9.3
11.1
70bp
180bp
A- & Above
30.6
32.3
33.8
46.8
32.4
31.4
32.6
(120)bp
120bp
BBB- & Above
47.6
47.0
45.8
47.5
48.6
50.1
47.3
150bp
(280)bp
bb+ & Below
6.2
5.5
5.7
5.7
5.6
5.9
7.0
130bp
110bp
Advance Mix (` cr)
C&IB
15,606
16,240
17,149
18,826
19,935
21,354
21,980
28
3
CB
7,106
7,512
7,837
8,303
8,541
8,875
8,733
11
(2)
Wholesale
22,712
23,752
24,986
27,129
28,476
30,229
30,713
23
2
Retail Asset
9,397
10,434
11,361
12,407
14,644
16,467
18,391
62
12
LAP
3,791
4,161
4,339
-
5,659
6,453
6,945
60
8
Credit Card
1,579
2,244
2,901
-
4,496
5,283
6,653
129
26
Retail Agri
1,578
1,538
1,525
-
1,562
1,571
1,523
(0)
(3)
BIL
984
1,049
1,160
-
1,358
1,459
1,504
30
3
Others
1,285
1,442
1,435
-
1,569
1,701
1,766
23
4
DB&FI
4,781
5,684
5,851
6,337
6,773
7,611
7,733
32
2
-Micro banking
2,886
3,560
3,698
3,917
4,220
5,028
4,969
34
(1)
-IFI
1,358
1,543
1,503
1,669
1,685
1,579
1,696
13
7
-MSME
536
581
649
751
868
1,004
1,068
65
6
Non-Wholesale
14,178
16,118
17,212
18,744
21,417
24,078
26,124
52
8
Total
36,890
39,870
42,198
45,873
49,893
54,307
56,837
35
5
Source: Company
July 22, 2019
3
Q1FY2020 Result Update | India Research
Income Statement
Particular (`)
FY17
FY18
FY19
FY20E
FY21E
Net Interest Income
1,221
1,766
2,539
3,434
4,635
- YoY Growth (%)
49
45
44
35
35
Other Income
755
1,068
1,442
1,961
2,524
- YoY Growth (%)
54
41
35
36
29
Operating Income
1,977
2,834
3,982
5,396
7,159
- YoY Growth (%)
51
43
40
36
33
Operating Expenses
1,056
1,504
2,042
2,689
3,553
- YoY Growth (%)
38
42
36
32
32
Pre - Provision Profit
920
1,331
1,940
2,707
3,606
- YoY Growth (%)
70
45
46
40
33
Prov. & Cont.
239
365
641
1,083
1,105
- YoY Growth (%)
109
53
76
69
2
Profit Before Tax
681
966
1,299
1,623
2,502
- YoY Growth (%)
59
42
34
25
54
Prov. for Taxation
235
331
432
552
851
- as a % of PBT
35
34
33
34
34
PAT
446
635
867
1,071
1,651
- YoY Growth (%)
53
42
37
24
54
Balance sheet
Y/E March (` cr)
FY17
FY18
FY19
FY20E
FY21E
Equity
375
420
427
427
427
Reserve & Surplus
3,960
6,264
7,121
8,031
9,435
Net worth
4,336
6,684
7,547
8,458
9,862
Deposits
34,588
43,902
58,394
78,395
1,05,272
- Growth (%)
42
27
33
34
34
Borrowings
7,980
9,261
11,832
15,618
20,616
Other Liab. & Prov.
1,785
2,003
2,585
4,262
6,055
Total Liabilities
48,689
61,851
80,359
1,06,733
1,41,804
Cash Balances
2,948
2,589
8,440
4,788
6,428
Bank Balances
1,246
1,695
1,763
2,736
3,673
Investments
13,482
15,448
16,840
23,938
32,142
Advances
29,449
40,268
54,308
72,230
96,066
- Growth (%)
39
37
35
33
33
Fixed Assets
259
334
402
616
826
Other Assets
1,306
1,517
2,206
2,426
2,669
Total Assets
48,689
61,851
83,959
1,06,733
1,41,804
- Growth (%)
24
27
36
27
33
July 22, 2019
4
Q1FY2020 Result Update | India Research
DuPont Analysis
Y/E March (%)
FY12
FY13
FY14
FY15
FY16
FY17
FY18
FY19E
FY20E
FY21E
Interest Income
8.91
8.72
8.68
8.62
8.28
8.45
8.16
8.86
9.02
9.04
Interest Expenses
5.33
6.17
6.48
6.17
5.81
5.67
4.96
5.29
5.35
5.31
NII
3.58
2.55
2.19
2.46
2.47
2.78
3.20
3.57
3.67
3.73
- Prov
0.36
0.22
0.30
0.27
0.35
0.54
0.66
0.90
1.16
0.89
Adj NII
3.22
2.33
1.90
2.19
2.13
2.24
2.54
2.67
2.51
2.84
Total Other Income
1.29
1.25
1.68
1.78
1.48
1.72
1.93
2.03
2.10
2.03
Total Income
4.51
3.58
3.57
3.97
3.61
3.95
4.47
4.70
4.61
4.87
Opex
2.68
2.22
2.72
2.65
2.31
2.40
2.72
2.87
2.87
2.86
PBT
1.83
1.36
0.85
1.32
1.29
1.55
1.75
1.83
1.74
2.01
TAX
0.58
0.44
0.26
0.41
0.41
0.54
0.60
0.61
0.59
0.68
RoA
1.25
0.92
0.59
0.91
0.88
1.02
1.15
1.22
1.15
1.33
Leverage
4.69
7.34
8.61
10.68
12.71
12.00
10.03
9.99
11.69
13.57
RoE
5.85
6.76
5.12
9.77
11.21
12.18
11.52
12.18
13.39
18.03
Ratio analysis
Y/E March (` Cr)
FY17
FY18
FY19E
FY20E
FY21E
Profitability ratios (%)
NIMs
2.9
3.4
3.7
3.8
3.9
Cost to Income Ratio
53.4
53.0
51.3
49.8
49.6
RoA
1.0
1.1
1.2
1.15
1.33
RoE
12.2
11.5
12.2
13.4
18.0
B/S ratios (%)
CASA Ratio
0.22
0.24
0.25
0.26
0.26
Credit/Deposit Ratio
0.9
0.9
0.9
0.9
0.9
Asset Quality (%)
Gross NPAs
1.21
1.41
1.33
2.25
2.00
Gross NPAs (` cr)
356.8
566.7
722.3
1,625
1,921.3
Net NPAs
0.64
0.78
0.73
1.10
1.10
Net NPAs (` cr)
189.9
314.0
396.5
794.5
1,056.7
Credit Cost on Advance
0.81
0.91
1.18
1.50
1.15
Provision Coverage
53%
55%
55%
49%
55%
Per Share Data (`)
EPS
10.4
14.8
20.3
25.1
38.6
BV
101.4
156.3
176.5
197.8
230.6
ABVPS (70% cover)
99.4
152.9
172.3
190.6
219.3
DPS
1.8
2.3
3.0
3.8
5.8
Valuation Ratios
PER (x)
47.9
33.7
24.7
20.0
13.0
P/BV
4.9
3.2
2.8
2.5
2.2
P/ABVPS (x)
5.0
3.3
2.9
2.6
2.28
Dividend Yield
0.4
0.5
0.6
0.8
1.2
Note - Valuation done on closing price of 19/07/2019
July 22, 2019
5
Q1FY2020 Result Update | India Research
Research Team Tel: 022 - 39357800
Angel Broking Limited (hereinafter referred to as “Angel”) is a registered Member of National Stock Exchange of India Limited, Bombay
Stock Exchange Limited, Metropolitan Stock Exchange Limited, Multi Commodity Exchange of India Ltd and National Commodity &
Derivatives Exchange Ltd It is also registered as a Depository Participant with CDSL and Portfolio Manager and Investment Adviser with
SEBI. It also has registration with AMFI as a Mutual Fund Distributor. Angel Broking Limited is a registered entity with SEBI for Research
Analyst in terms of SEBI (Research Analyst) Regulations, 2014 vide registration number INH000000164. Angel or its associates has not
been debarred/ suspended by SEBI or any other regulatory authority for accessing /dealing in securities Market. Angel or its
associates/analyst has not received any compensation / managed or co-managed public offering of securities of the company covered
by Analyst during the past twelve months.
This document is solely for the personal information of the recipient, and must not be singularly used as the basis of any investment
decision. Nothing in this document should be construed as investment or financial advice. Each recipient of this document should
make such investigations as they deem necessary to arrive at an independent evaluation of an investment in the securities of the
companies referred to in this document (including the merits and risks involved), and should consult their own advisors to determine
the merits and risks of such an investment.
Reports based on technical and derivative analysis center on studying charts of a stock's price movement, outstanding positions and
trading volume, as opposed to focusing on a company's fundamentals and, as such, may not match with a report on a company's
fundamentals. Investors are advised to refer the Fundamental and Technical Research Reports available on our website to evaluate the
contrary view, if any
The information in this document has been printed on the basis of publicly available information, internal data and other reliable
sources believed to be true, but we do not represent that it is accurate or complete and it should not be relied on as such, as this
document is for general guidance only. Angel Broking Limited or any of its affiliates/ group companies shall not be in any way
responsible for any loss or damage that may arise to any person from any inadvertent error in the information contained in this report.
Angel Broking Limited has not independently verified all the information contained within this document. Accordingly, we cannot testify,
nor make any representation or warranty, express or implied, to the accuracy, contents or data contained within this document. While
Angel Broking Limited endeavors to update on a reasonable basis the information discussed in this material, there may be regulatory,
compliance, or other reasons that prevent us from doing so.
This document is being supplied to you solely for your information, and its contents, information or data may not be reproduced,
redistributed or passed on, directly or indirectly.
Neither Angel Broking Limited, nor its directors, employees or affiliates shall be liable for any loss or damage that may arise from or in
connection with the use of this information.
Disclosure of Interest Statement
Yes Bank
1. Financial interest of research analyst or Angel or his Associate or his relative
No
2. Ownership of 1% or more of the stock by research analyst or Angel or associates or relatives
No
3. Served as an officer, director or employee of the company covered under Research
No
4. Broking relationship with company covered under Research
No
July 22, 2019
6